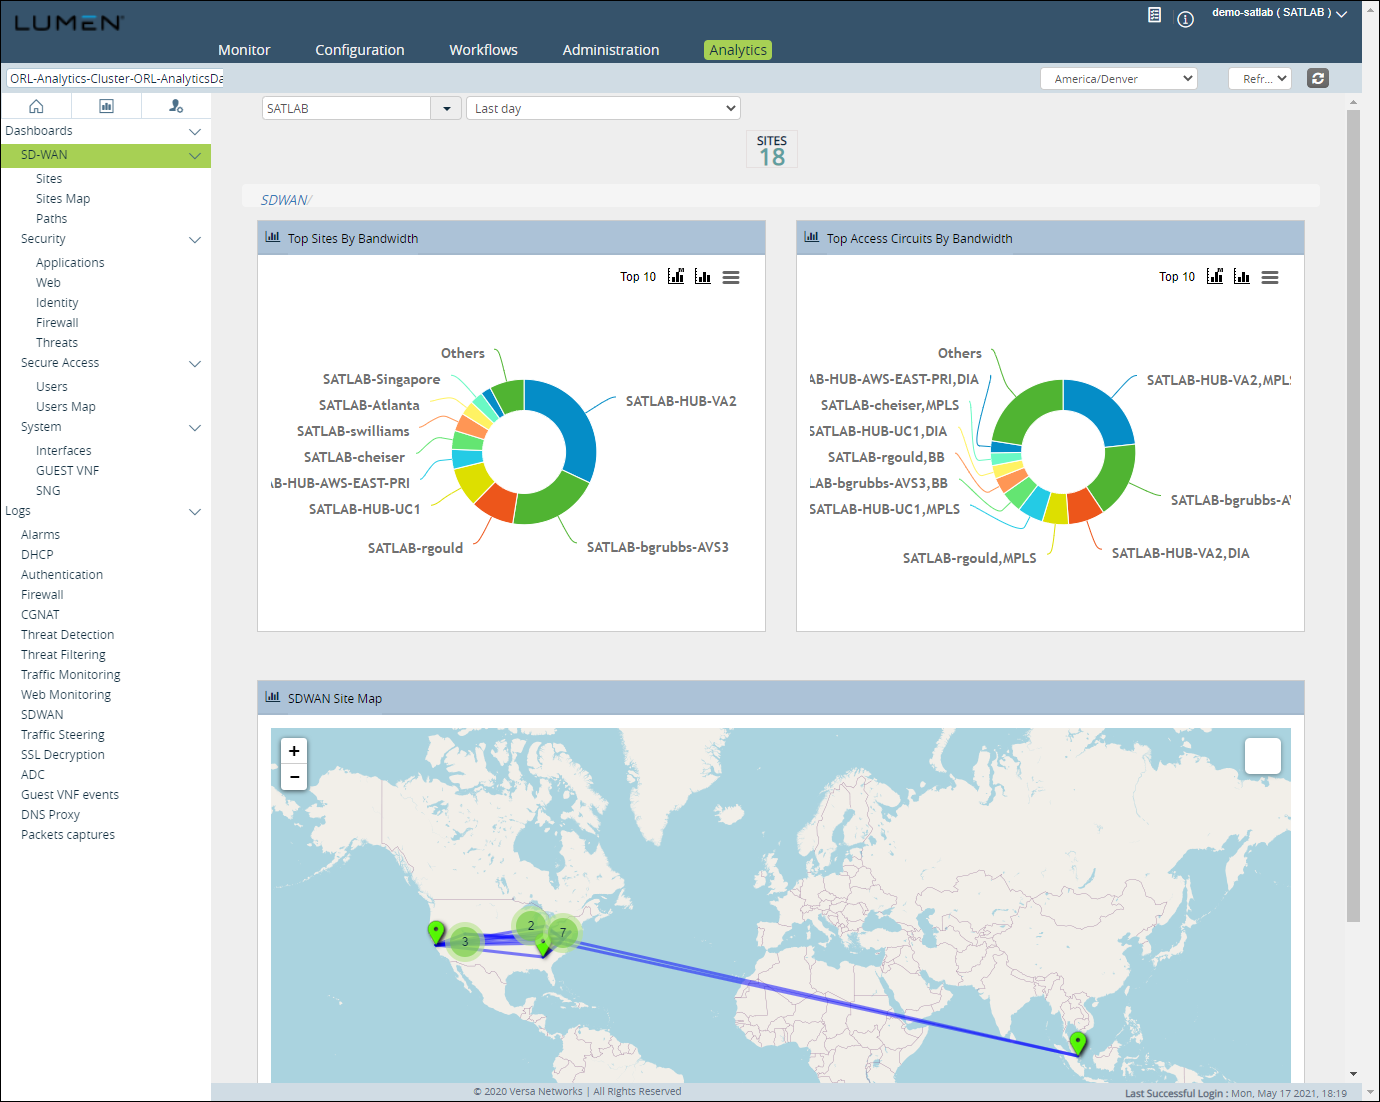
Exploring the SD‑WAN Analytics dashboards
The SD‑WAN analytics dashboards shows your traffic detail on the SD‑WAN appliance and the performance of its paths to other appliances. Information you can get from the dashboards includes:
- Availability—shows appliance availability
- Access circuits—shows traffic by circuit
- Users—shows traffic by IP/user
- Applications—shows traffic by application
- Rules—shows performance metrics and traffic by forwarding profile
- SLA metrics—shows use of your total WAN traffic
- SLA violations—shows violations
- VRF—shows latency to monitored applications
- QoS—traffic by QoS tier
- APM—VRF traffic by routing instance
- MOS—scores for real‑time traffic
There are three views under the Analytics tab:
- Dashboard view
- Reporting view
- Administrator view
Dashboard view
The Dashboard view also provides log information for:
- alarms
- DHCP
- firewall
- CGNAT
- DOS
- IDP
- antivirus
- URL filtering
- IP filtering
- Traffic monitoring
- Web monitoring
- SD‑WAN
- SD‑WAN SLA violation
- SSL decryption
- ADC
- Guest VNF events
- Packet captures
You can filter the data at various levels:
- For a tenant
- All the appliances or an individual appliance
- Time selector (Last 5 minutes, Last 15 minutes, Last 30 minutes, Last hour, Last 12 hours, Last day, Last 7 days, Last month, Custom range)
The dashboard provides you with a facility to see the latest data.
- Click Refresh to fetch the latest data based on every 1, 10 or 15 minutes.
- Click the Manual Refresh icon for a manual refresh. Each tile in the dashboard allows you to change the graphical representation of the data.
- Click the Chart icon in each tile to change the current graphical data representation to a column, bar, pie, or line chart.
- Click the Print/Download icon in the tile to download the chart as an image for further analysis. You can save the data as a PNG, JPEG, PDF, or SVG vector.
- Click the Chart with Metrics icon in the tile to view the same graph with various metrics view. You can view metrics based on these typical usage reports:
- bandwidth
- volume Tx
- volume Rx
- volume Tx, Rx
- uplink/downlink bandwidth
The dashboard allows you to either minimize or maximize each tile to suit your viewing requirement.
Reporting view
Use the Reporting view to build custom reports in PDF, XLS, and JSON format. You can schedule and generate the reports periodically and send it as an email.