Toggle Navigation Toggle Navigation
  • Lumen Connect overview
  • Getting started/General
  • Services
  • APIs
  • Monitoring & Reports
  • Billing
  • Admin
  • Support
  • Orders (Wholesale)
  • Other portals overview
  • Media portal
  • DDoS Mitigation & Reporting
  • Security Solutions portal
  • VoIP portal
  • View all product support
  • Infrastructure
  • Connectivity
  • Security
  • Communication
  • Media & Entertainment
  • LSR portal
  • Port Out Request tool
  • Virtual Front Office
  • Readiness overview
  • Product-specific readiness
  • Handbooks
  • All infrastructure services
  • Edge Bare Metal
  • Edge Gateway
  • Edge Private Cloud
  • Encrypted Wavelength Service
  • Network Storage
  • All connectivity services
  • Ethernet On-Demand
  • Fiber+ Internet
  • Internet On-Demand
  • IP VPN On-Demand
  • NaaS Port
  • On-Demand services
  • Troubleshooting tools
  • All security services
  • Adaptive Network Security
  • Adaptive Threat Intelligence
  • Application Delivery Solutions
  • DDoS Hyper
  • DDoS Mitigation Service
  • Lumen Defender Powered by Black Lotus Labs
  • Lumen SASE with Fortinet
  • Lumen SASE with Versa
  • Lumen SASE with VMware
  • Network-based Security
  • SD-WAN with Cisco Meraki
  • SD-WAN with Versa Networks
  • Security Log Monitoring
  • All communication services
  • Cloud Voice
  • Hosted VoIP
  • Local Inbound (LI)
  • Lumen Solutions for Microsoft Teams
  • Lumen Solutions for Webex
  • Lumen Solutions for Zoom
  • Lumen Solutions for Zoom for Government
  • SIP Trunking
  • Unified Communications and Collaboration
  • Voice Complete
  • VoIP Enhanced Local (ELS)
  • VoIP services
  • Vyvx® Broadcast Solutions
  • North America
  • Asia Pacific (APAC)

Accessing and using the Contact Center Supervisor Client dashboard
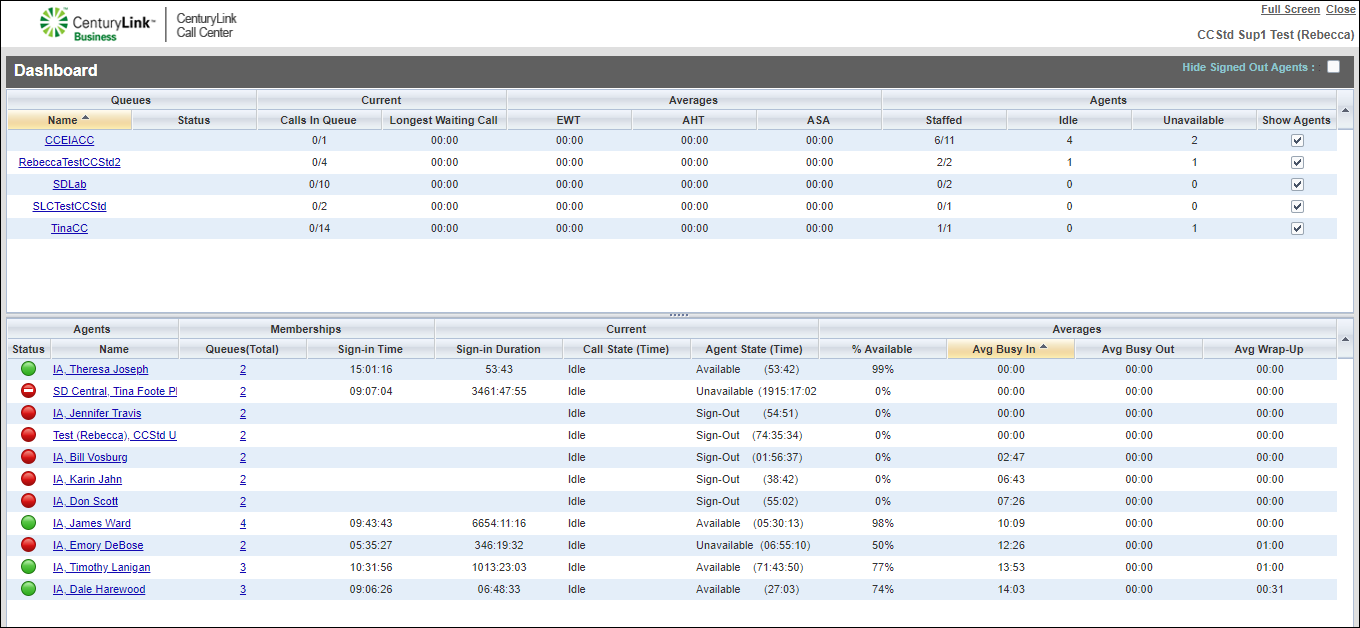
To access and use the dashboard:

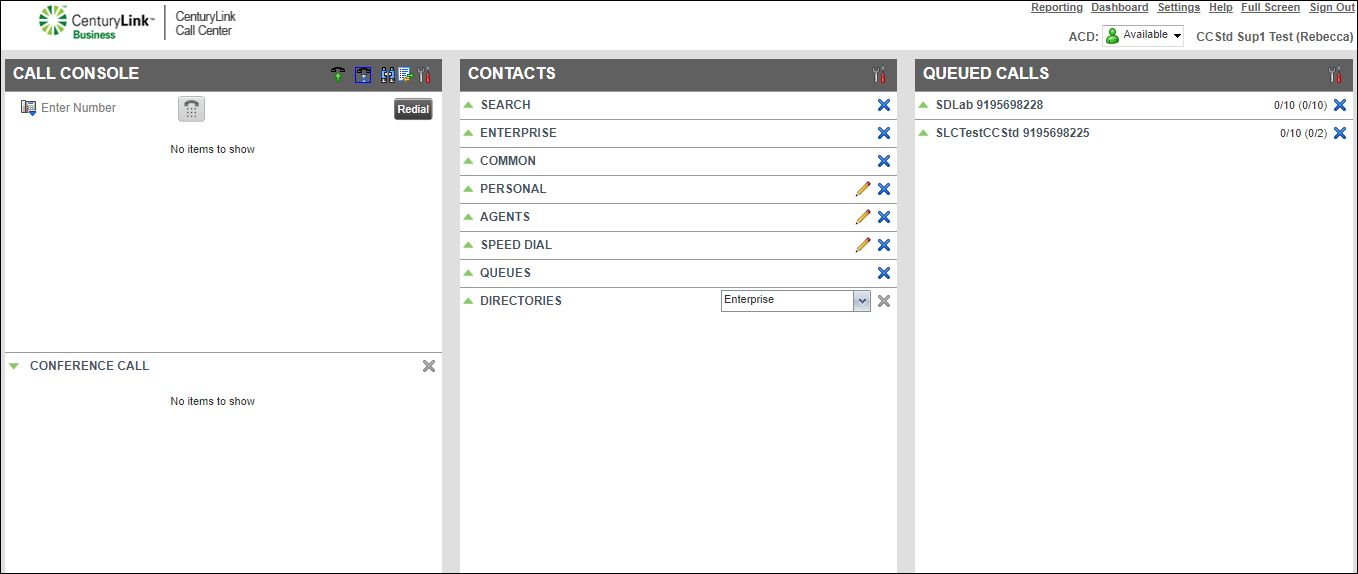
  1. From the top menu on the right, click Dashboard.

    The dashboard opens in a new window with queue statistics on top. The agent statistics (the bottom area) won’t display until you select the queue(s) you want the agent’s statistics to show.
  1. To show the agents’ statistics in a queue, from the queue area in the Show Agents column, select the checkbox for each queue you want agent statistics to show.
Contact Center Client dashboard