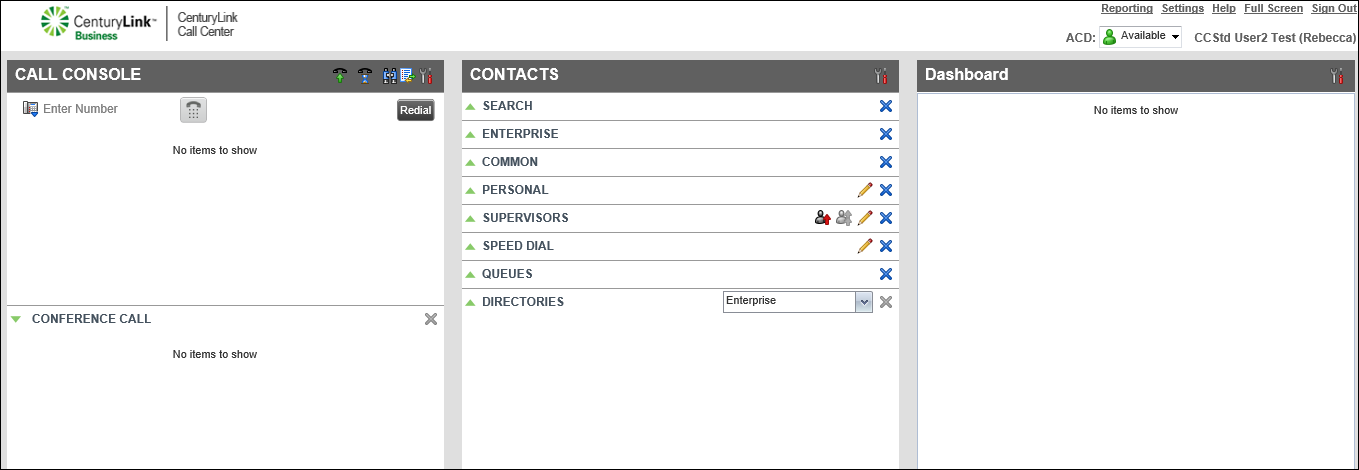
Changing your dashboard queue statistics sort order
You can list calling queue statistics on your Contact Center Client dashboard in the order that highlights the ones that are most important to you. For example, if you want to see statistics for the queues with the longest call waiting time first, you can sort by descending order and then select the current calls queue.
To change your dashboard queue statistics sort order:
- On the header bar of the Dashboard pane, click the Options icon, then click Sort By.
- To choose the order the field statistics appear, click Ascending or Descending.
- Select the fields you want to sort by, such as by the queue name or current calls in queue.
Queue statistics available:
- Current Calls in Queue—number of calls waiting in the queue along with the maximum number of calls for that queue
- EWT (Estimated Wait Time)—expected wait time for callers in the queue
- ASA (Average Speed of Answer)—average amount of time a caller spends in the queue before the call is routed to an agent
- Longest Waiting Call—wait time of the call that’s been in the queue the longest
- AHT (Average Handle Time)—average handling time for calls in the queue
- Staffed (Agents)—number of agents signed in, available, unavailable, in wrap-up state, and the number of agents assigned to the queue
- Current Calls in Queue—number of calls waiting in the queue along with the maximum number of calls for that queue
Your calling queue statistics are reordered on your dashboard and will stay that way until you change the order again.


