Viewing traffic by profile
The DDoS Mitigation and Reporting portal shows traffic reports for all monitored networks broken down by profile. A profile is a managed object or zone.
In indicates traffic out of your network ("in" to Lumen). Out represents traffic into your network ("out" of Lumen). Dropped is the traffic backbone routers report as dropped, and is not related to DDoS mitigations.
To view a traffic reports by profile:
- Depending on your DDoS product, you can access the DDoS Mitigation and Reporting dashboard using one of the following methods:
- Using the left menu, click Services, click Service Portals, then click DDoS Mitigation and Reporting. Confirm that you are going to an external site, then click Log In with SSO.
- Using the left menu, click Monitoring & Reports, click Security Solutions Analytics, then click DDoS Mitigation and Reporting (in either the Reports or DDoS Mitigation Service sections).
- Using the left menu, click Services, click Service Portals, then click DDoS Mitigation and Reporting. Confirm that you are going to an external site, then click Log In with SSO.
The DDoS Mitigation and Reporting portal shows the dashboard.
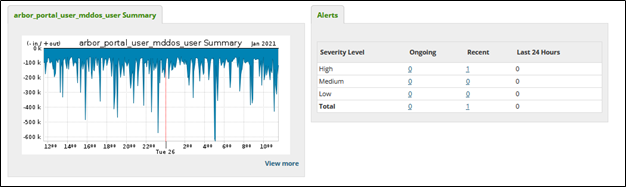
- Click the Traffic tab.
The DDoS Mitigation and Reporting portal shows a summary of the traffic for all monitored networks broken down by profile.
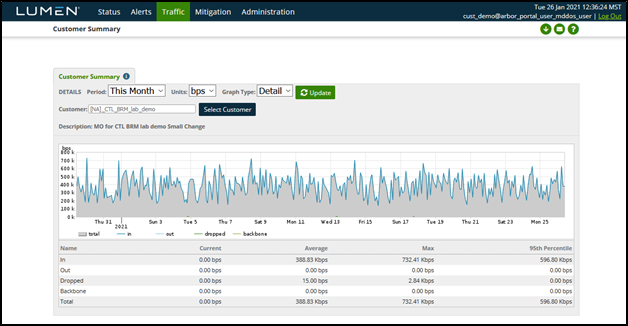
- Do any of the following to change the traffic summary:
- Click the Period menu to modify the summary to show different timeframes.
- Click the Units menu to switch between bits per second (bps) and packets per second (pps).
- Click the Graph Type menu to change the graph from stacked to pie or bar.
- Click Select Customer to view a different profile.
- Uncheck a direction or category to remove it from the graph.
- Click a column header to sort the table. Click the header again to reverse the order.
- Click the Period menu to modify the summary to show different timeframes.


