Viewing interfaces for a managed router
Using Network Visibility (within Lumen Connect), you can view the WAN- and LAN-side interfaces for a managed router on a Lumen network service. While viewing interfaces for a managed router, you can view utilization metrics for each interface. You can also use Network Visibility to view utilization metrics for services.
To view interfaces for a managed router:
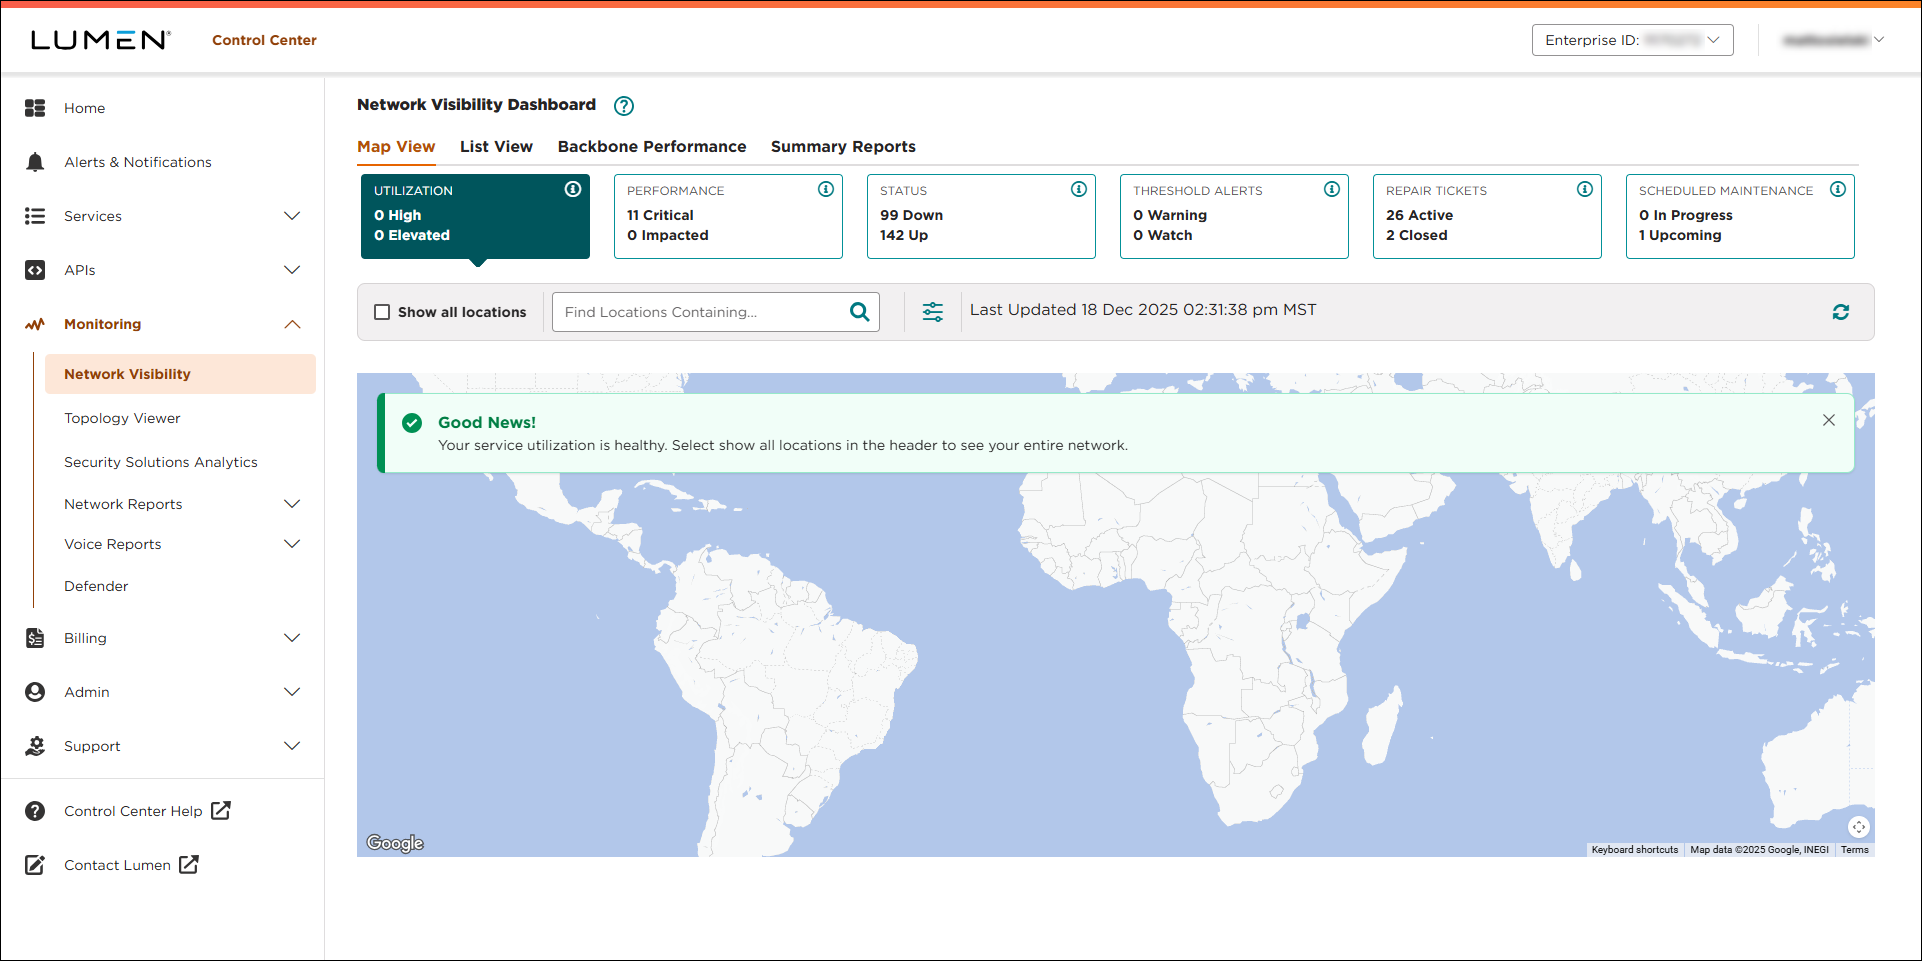
- Using the left menu, click Monitoring, then click Network Visibility.
Lumen Connect opens Network Visibility. On the map, Lumen Connect shows locations with services needing your attention. Tiles show services with high utilization or critical issues, services that are down or have threshold warnings, as well as open tickets and scheduled maintenance for your services. Use the Map View, List View, Backbone Performance, and Summary Reports tabs above the tiles to toggle between views.
- Search for the service you want to work with:
- From the List View tab, do any of the following:
- Use the Locations tab to scroll through the list of locations or search for a location with the service you want to work with, click the hyperlink in the Location Address column for the location, then click a service in the left panel for the location.
- Use the Services tab to scroll through the list of services or search for a service, then click the hyperlink in the Service ID or SCID column for the service.
- Use the Select All Products list to see locations with that product or services matching that product type.
- Filter the list by clicking the icon, then using any of the filters that appear. You can filter by service ID, product, device, location address, location name, VPN ID, or service component ID (SCID).
- Use the Locations tab to scroll through the list of locations or search for a location with the service you want to work with, click the hyperlink in the Location Address column for the location, then click a service in the left panel for the location.
- From the Map View tab, do any of the following:
- Select a location on the map, then click a service in the left panel for the location.
- Select the Show all locations checkbox, select a location on the map, then click a service in the left panel for the location.
- Use the search box to find a location with the service you want to work with, select the location on the map, then click a service in the left panel for the location.
- Filter the list by clicking the icon, then using any of the filters that appear. You can filter by service ID, product, device, location address, location name, VPN ID, or service component ID (SCID).
- Select a location on the map, then click a service in the left panel for the location.
- From the List View tab, do any of the following:
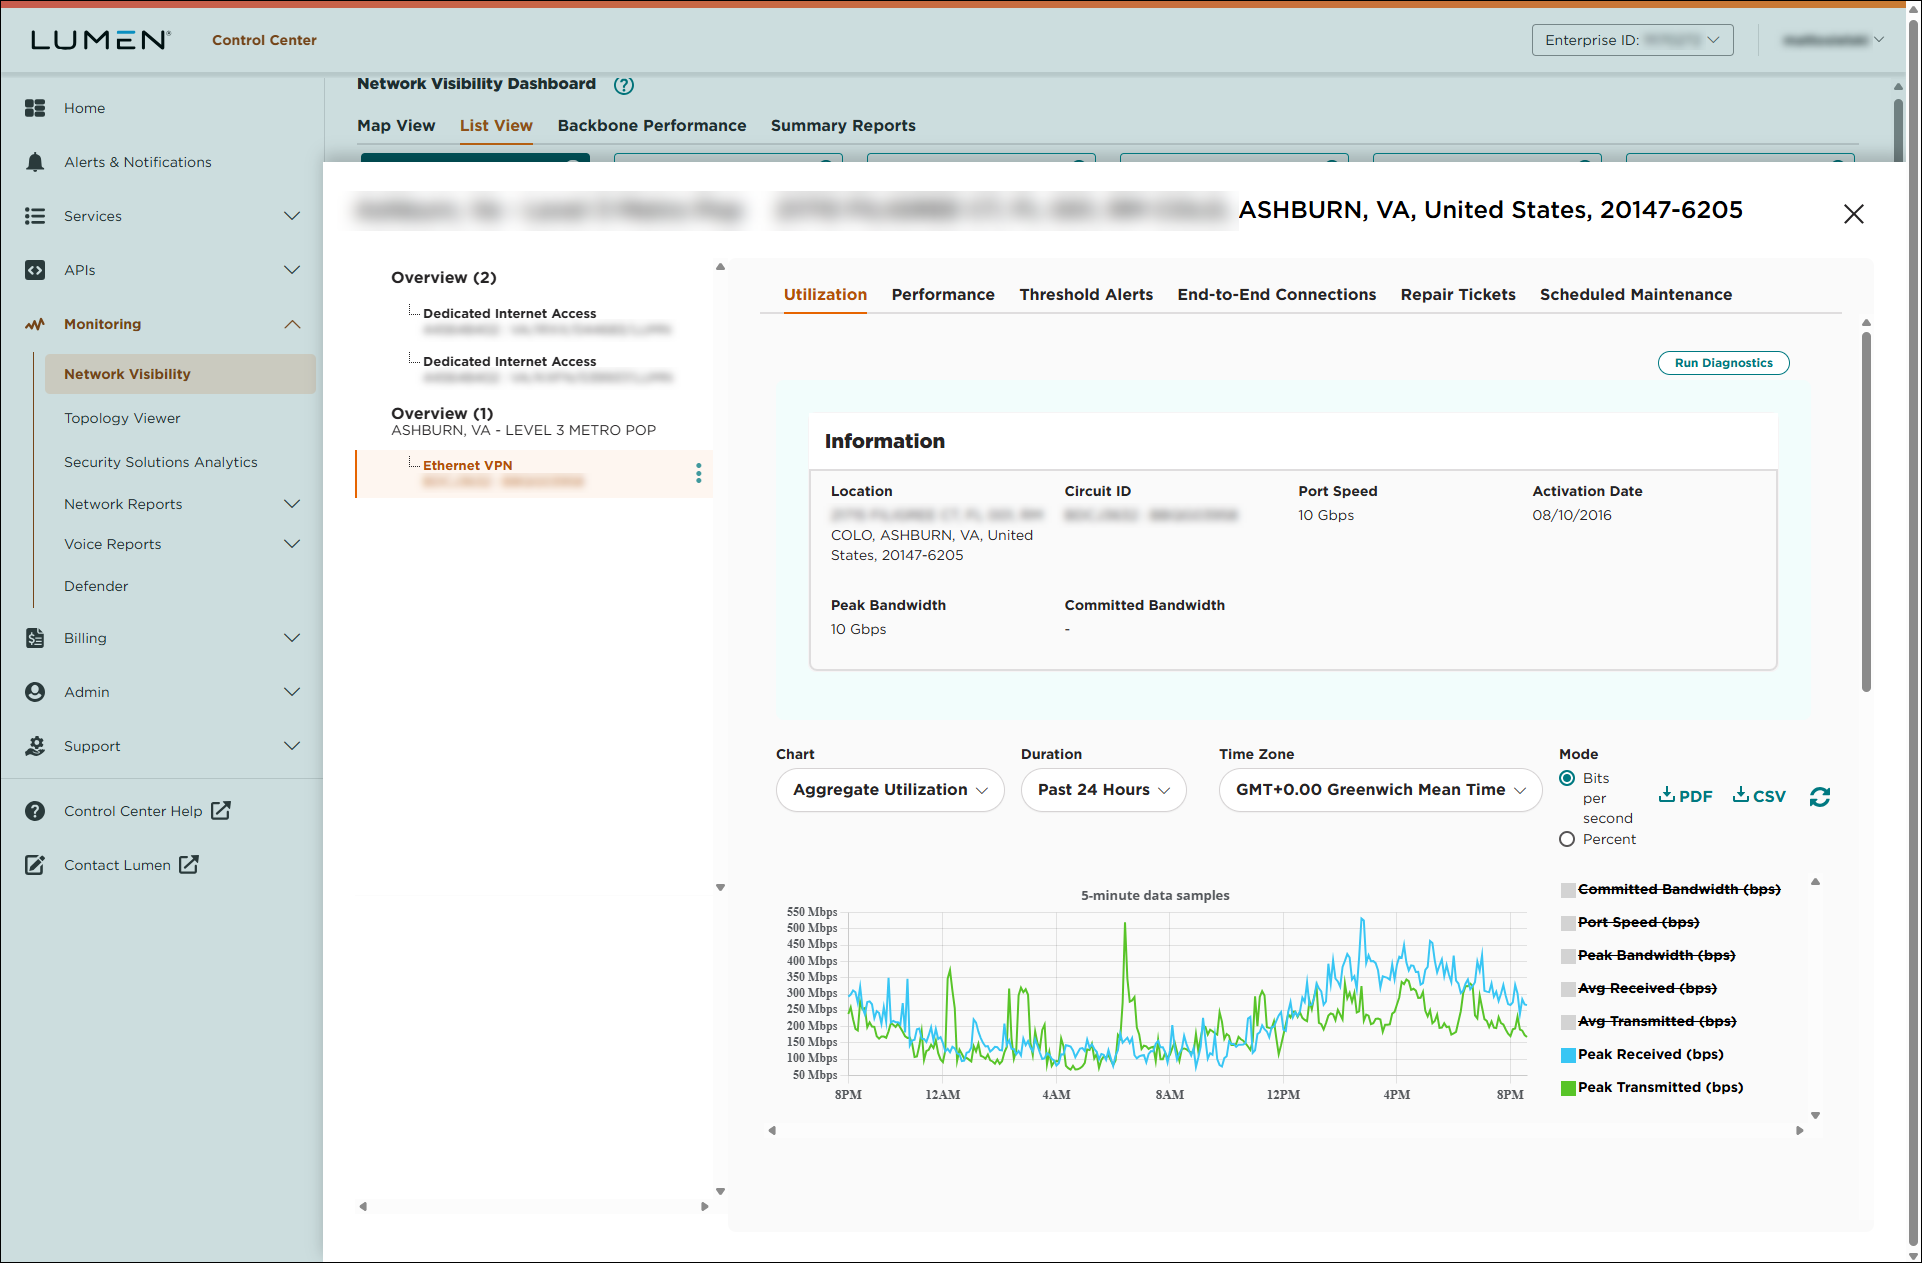
Lumen Connect shows details for the service you selected.
- In the left panel, click the managed router under the service you selected.
Lumen Connect shows details for the router: device ID, management IP address, vendor and model, etc. If the router configuration is available, Lumen Connect adds a link to view the configuration file.
- Click the Interfaces tab.
Lumen Connect shows the interfaces for the manager router.
- To view metrics for an interface, click the on the row for the interface.
Lumen Connect shows utilization for the interface for the past 24 hours. Use the fields to change the duration, mode, and time zone as needed. You can also download the metrics in CSV or PDF format.


