Viewing a summary network performance report
Using Network Visibility, you can create and download several types of summary reports (in Excel or .csv format): active end to end, active POP to POP, interfaces, network management, and class of service. Report types vary based on your Lumen services. Network Visibility also offers backbone performance metrics.
To view a summary network performance report:
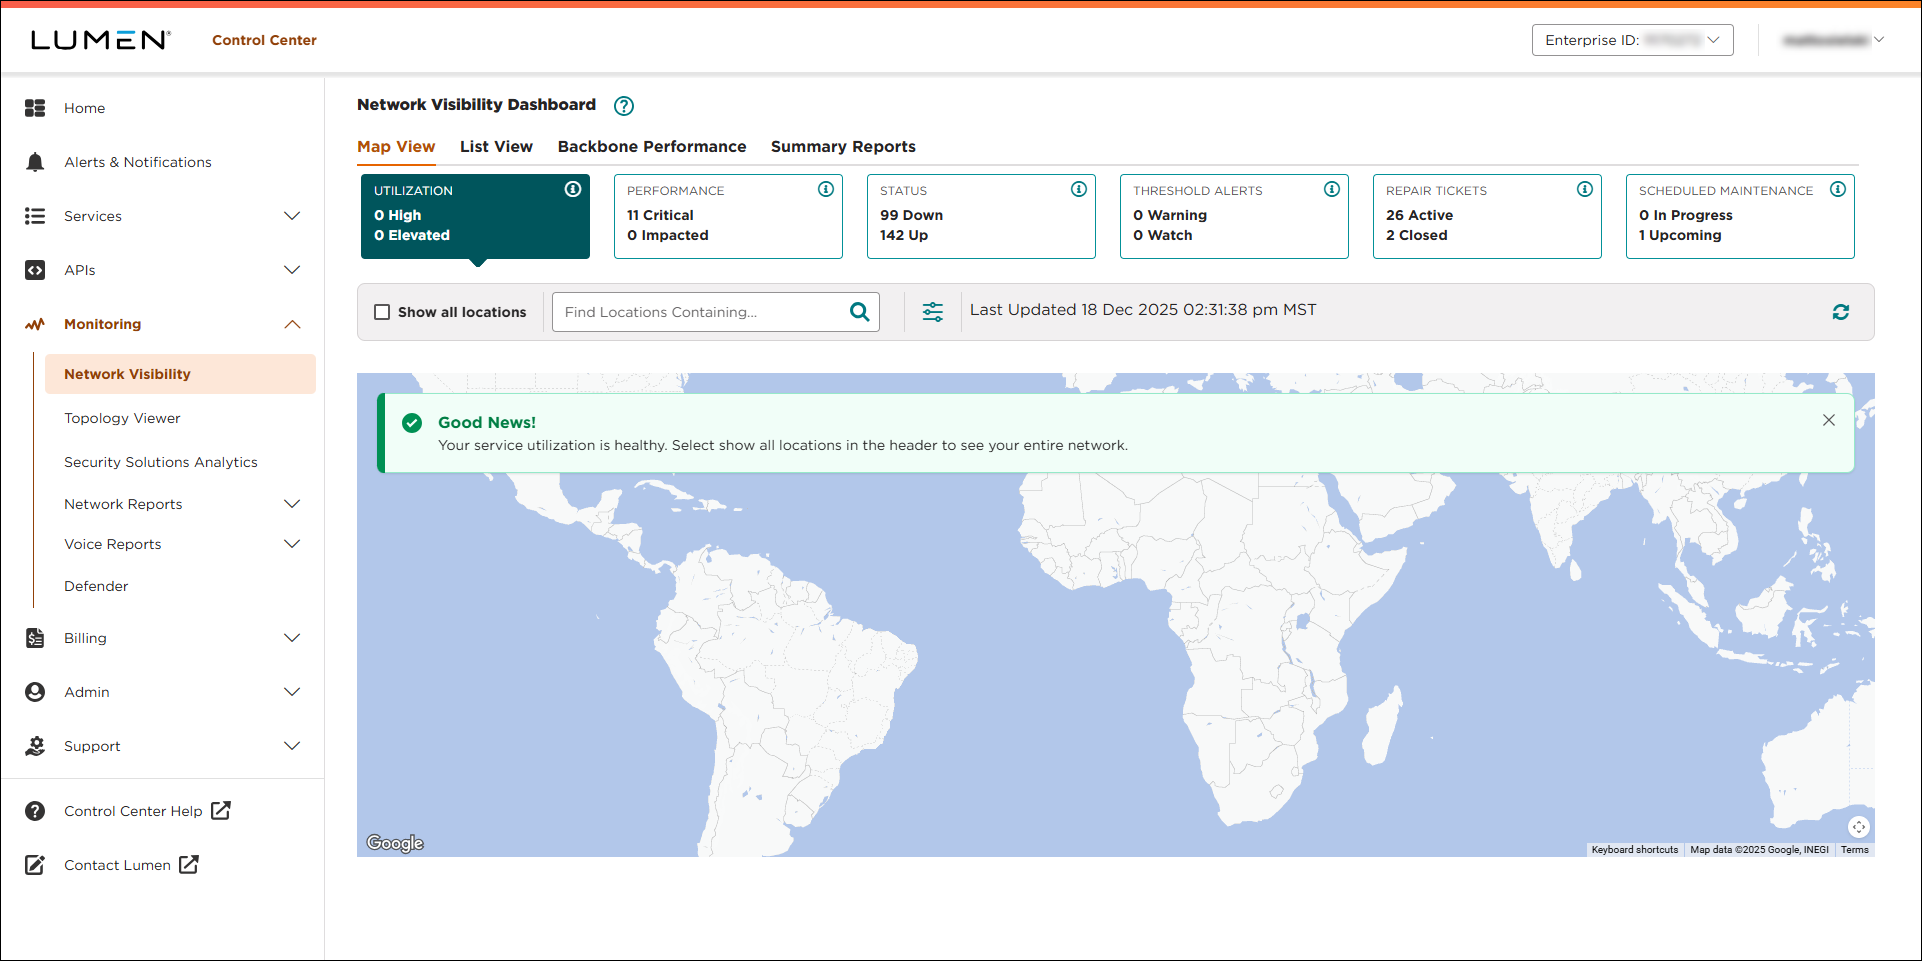
- Using the left menu, click Monitoring, then click Network Visibility.
Lumen Connect opens Network Visibility. On the map, Lumen Connect shows locations with services needing your attention. Tiles show services with high utilization or critical issues, services that are down or have threshold warnings, as well as open tickets and scheduled maintenance for your services. Use the Map View, List View, Backbone Performance, and Summary Reports tabs above the tiles to toggle between views.
- Click Summary Reports.
- Select the checkboxes next to the report you want to view. (Each checkbox you select creates a separate file for each summary report.)
- From the Duration list, select the time period for the report: Daily (data for a specific day, such as today), Weekly (data for a full week—starting on a Sunday), Monthly (data for a full calendar month).
- Based on the report duration you selected, do one of the following:
- If you selected Daily, click the icon to select the day you want to view a summary report for.
- If you selected Weekly, click the icon to select the Sunday of the week you want to view a summary report for.
- If you selected Monthly, use the Month and Year lists to select the month you want to view a summary report for.
- If you selected Daily, click the icon to select the day you want to view a summary report for.
- Use the File Type toggle to select the format for the summary report: Excel spreadsheet or .csv file.
- Click DOWNLOAD REPORT(S).
Lumen Connect creates the summary report(s) you requested and provides a status for each:
- In Progress: Lumen Connect is still creating the report.
- Failed: Lumen Connect wasn't able to create the report.
- Success: Lumen Connect created the report and downloaded the file to your computer (using the folder set for downloads in your browser).
- In Progress: Lumen Connect is still creating the report.


