Viewing the systems generating the most traffic
The DDoS Mitigation and Reporting portal shows the systems generating the most traffic on the network.
The time and individual peak rate are shown for top-ranked hosts. Each host has a unique color in the graph. DNS host names appear next to the IP address if they can be resolved.
You can also view a TCP traffic summary or a traffic summary by IP-level protocol.
To view traffic top talkers:
- Depending on your DDoS product, you can access the DDoS Mitigation and Reporting dashboard using one of the following methods:
- Using the left menu, click Services, click Service Portals, then click DDoS Mitigation and Reporting. Confirm that you are going to an external site, then click Log In with SSO.
- Using the left menu, click Monitoring & Reports, click Security Solutions Analytics, then click DDoS Mitigation and Reporting (in either the Reports or DDoS Mitigation Service sections).
- Using the left menu, click Services, click Service Portals, then click DDoS Mitigation and Reporting. Confirm that you are going to an external site, then click Log In with SSO.
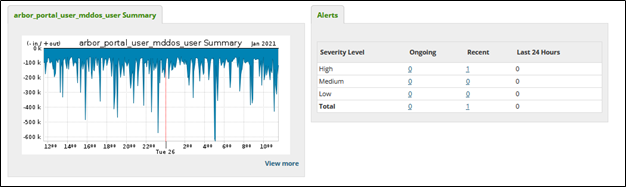
The DDoS Mitigation and Reporting portal shows the dashboard.
- Click the Traffic tab click Profiles, then click Top Talkers or Top Talkers IPv6.
The DDoS Mitigation and Reporting portal shows a summary of the traffic for all monitored networks broken down by IP address.
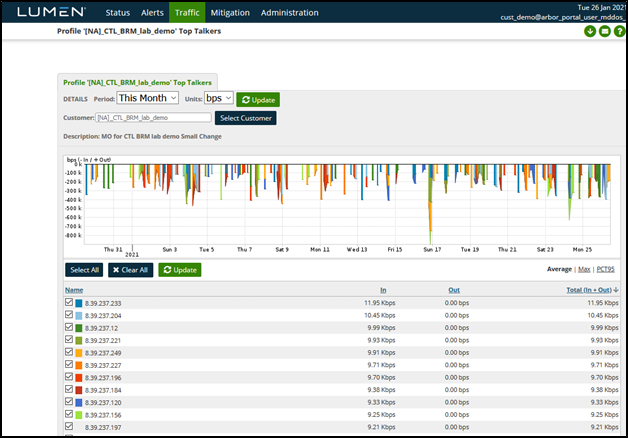
- Do any of the following to change the traffic summary:
- Click the Time menu to modify the summary to show different timeframes, then click Update.
- Select a date and time from Start and End to specify a timeframe, then click Update.
- Click the Units menu to switch between bits per second (bps) and packets per second (pps), then click Update.
- Click Select Customer to select a different profile, then click OK.
- Uncheck a host to remove it from the graph.
- Click a column header to sort the table. Click the header again to reverse the order.
- Click the Time menu to modify the summary to show different timeframes, then click Update.


