Viewing ongoing or recent mitigation details
The DDoS Mitigation and Reporting portal (available within Lumen Connect®) shows details about any ongoing or recent mitigations started manually by the Lumen SOC or through auto-mitigation triggered by a high severity alert.
Details include countermeasures used and the amount of traffic passed or dropped.
You can also view a DDoS alert summary and DDoS alert traffic details.
To view ongoing or recent DDoS mitigations:
- Depending on your DDoS product, you can access the DDoS Mitigation and Reporting dashboard using one of the following methods:
- Using the left menu, click Services, click Service Portals, then click DDoS Mitigation and Reporting. Confirm that you are going to an external site, then click Log In with SSO.
- Using the left menu, click Monitoring & Reports, click Security Solutions Analytics, then click DDoS Mitigation and Reporting (in either the Reports or DDoS Mitigation Service sections).
- Using the left menu, click Services, click Service Portals, then click DDoS Mitigation and Reporting. Confirm that you are going to an external site, then click Log In with SSO.
The DDoS Mitigation and Reporting portal shows the dashboard.
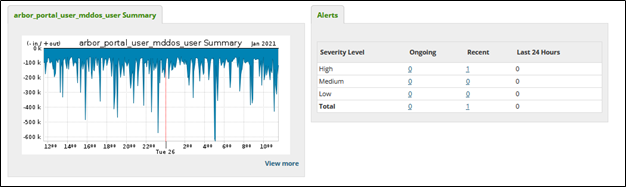
- Click the Mitigation tab, then click Ongoing or Recent.
The DDoS Mitigation and Reporting portal shows ongoing or recent mitigations.

- To view more details, do any of the following:
- To see the scrubbing centers the traffic entered, click the Per TMS tab.
- To view which countermeasures dropped the majority of the traffic volume, click the Per Countermeasures tab.
- To view additional filters, click the + next to a countermeasure.
- To see the scrubbing centers the traffic entered, click the Per TMS tab.



