Viewing DDoS alerts
The DDoS Mitigation and Reporting portal (available within Lumen Connect®) shows DDoS alerts based on importance. The Peakflow system automatically assigns importance based on various criteria.
Alert details show the type of alert and the name of the managed object (often called "zone") that is affected.
You can also view a DDoS alert summary, DDoS alert traffic details, and recent or ongoing mitigations.
To view DDoS alerts:
- Depending on your DDoS product, you can access the DDoS Mitigation and Reporting dashboard using one of the following methods:
- Using the left menu, click Services, click Service Portals, then click DDoS Mitigation and Reporting. Confirm that you are going to an external site, then click Log In with SSO.
- Using the left menu, click Monitoring & Reports, click Security Solutions Analytics, then click DDoS Mitigation and Reporting (in either the Reports or DDoS Mitigation Service sections).
- Using the left menu, click Services, click Service Portals, then click DDoS Mitigation and Reporting. Confirm that you are going to an external site, then click Log In with SSO.
The DDoS Mitigation and Reporting portal shows the dashboard.
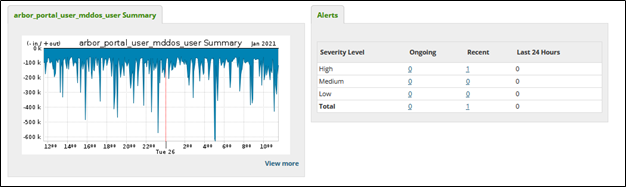
- Click the Alerts tab, then click All Alerts or Ongoing.
The DDoS Mitigation and Reporting portal shows all DDoS alerts.
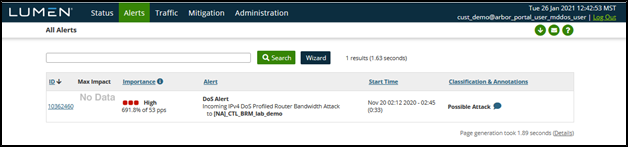
- To change DDoS alerts view, do any of the following:
- To sort by ID, click the ID column.
- To switch between bits per second (bps) and packets per second (pps), select an option from the Units menu, then click Update.
- To change the graph from stacked to pie or bar, select an option from the Graph Type menu, then click Update.
- To remove an application from the graph, clear the checkbox on the row for the application.
- To sort the table by a column, click the column header. (To reverse the order, click the column header again.)
- To sort by ID, click the ID column.



