Viewing metrics for a managed router
Use Network Visibility (within Lumen Connect®) to view environmental metrics (CPU and memory) for a managed router on a Lumen service. You can also view WAN‑ and LAN‑side interfaces for a router (with associated metrics) as well as details for the router (such as the router configuration).
To view metrics for a managed router:
- Using the left menu, click Monitoring, then click Network Visibility.
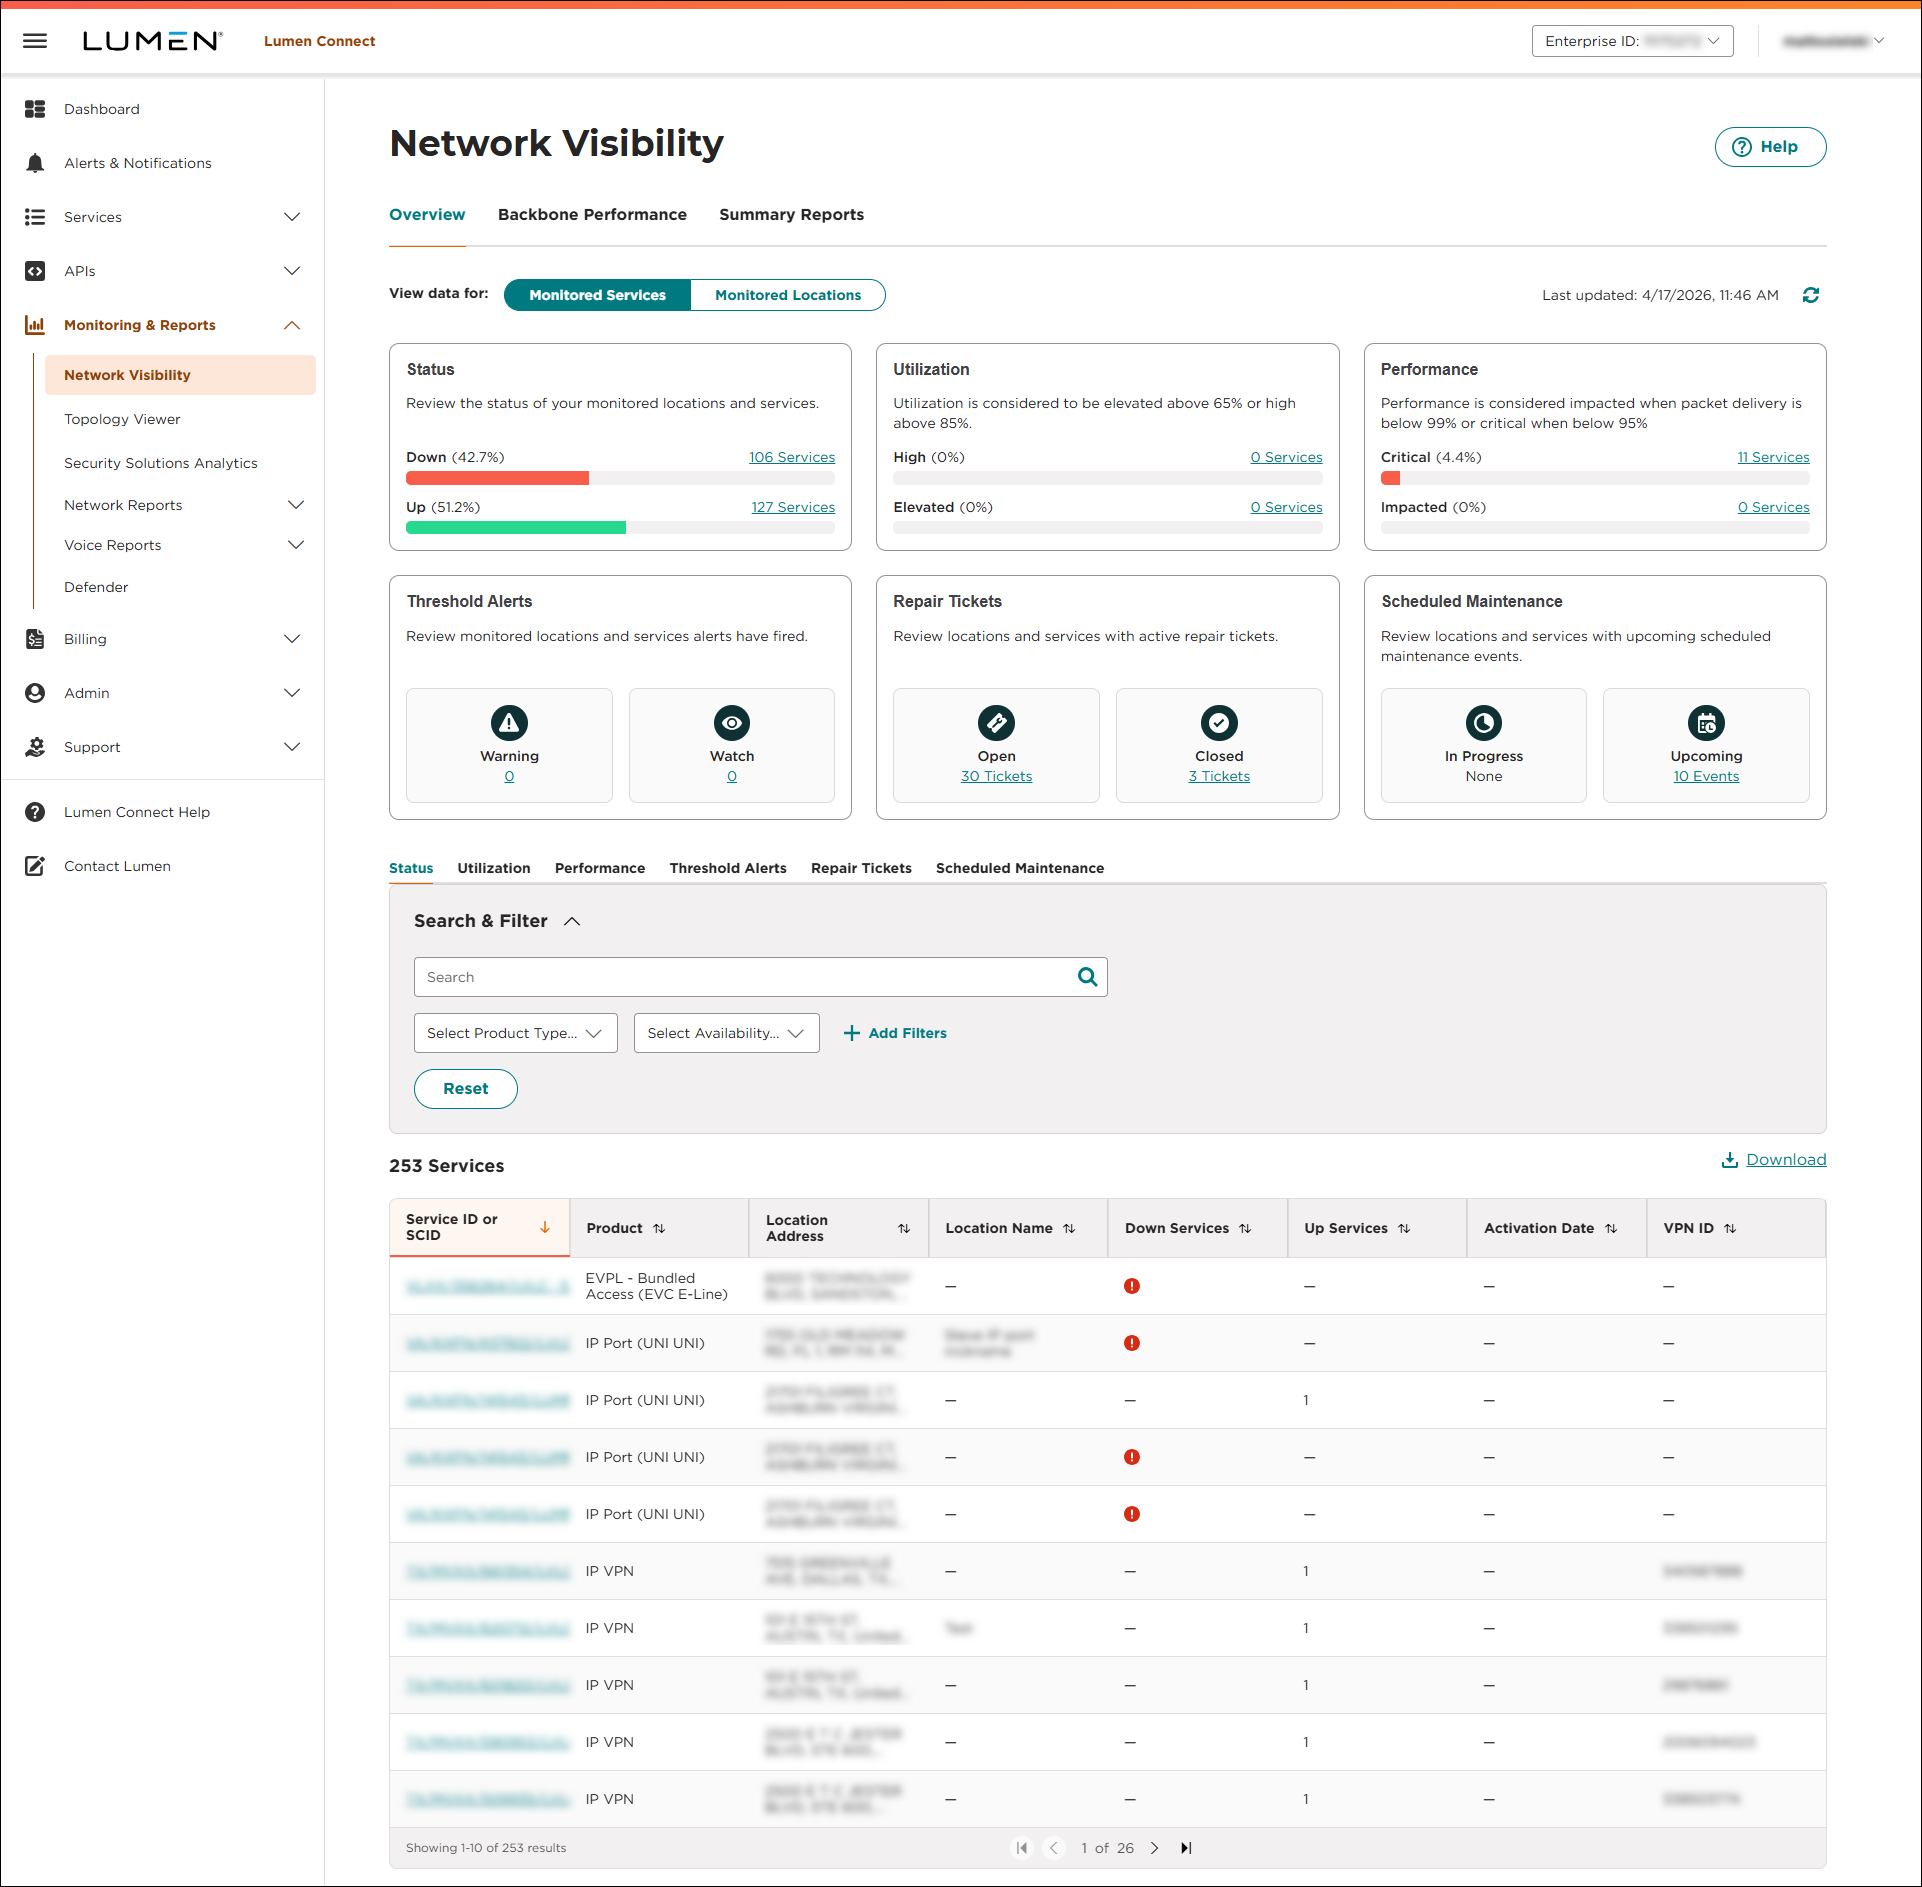
Lumen Connect opens Network Visibility. Tiles show a quick view of your network services: status, utilization, and performance. You'll also see tiles for threshold alerts, repair tickets, and scheduled maintenance (planned network maintenance). Below the tiles, you can view a list of your services by status, utilization, or performance, and those with threshold alerts, repair tickets, or scheduled maintenance associated with them. You can also view your services by location on a map using the Monitored Locations toggle. Use the Backbone Performance and Summary Reports tabs to access additional network performance data. (To refresh the data show, click thecached icon.)
- Search for the service you want to work with:
- From the Monitored Services view, do any of the following:
- Use the tiles to access a filtered list of services based on status, utilization, or performance.
- Use the tiles to see a filtered list of services with active threshold alerts, open or recently closed repair tickets, or in progess or upcoming scheduled maintenance (planned network maintenance).
- Below the tiles, use the tabs to see a list of your services by status, utilization, or performance, and those with threshold alerts, repair tickets, or scheduled maintenance associated with them.
- Use the tiles to access a filtered list of services based on status, utilization, or performance.
- From the Monitored Locations view, select a location on the map, then click the service you want to work with.
- From the Monitored Services view, do any of the following:
Based on the service you selected, Lumen Connect shows all services that location.
- Below the row for the service, click the row for the associated device.
Network Visibility shows the details for the device you selected: device ID, management IP address, vendor and model, etc. If the router configuration is available, Lumen Connect adds a link to view the configuration file.
- Click the Metrics tab.
Lumen Connect shows the metrics for the manager router.



