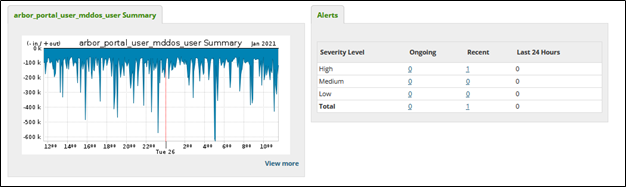
Viewing a DDoS alert summary
From the DDoS alerts page in the DDoS Mitigation and Reporting portal, you can view a summary for each alert. The summary shows a graph of total traffic associated with the affected IPs during the alert, along with some information about the alert, such as the data rates, alert type, and affected profile.
Alert Characteristics shows the most relevant source, destination IPs, ports, and protocols. Protocol-appropriate information, such as TCP Flags and ICMP codes, is also shown. Characteristics are more or less specific depending on traffic variation.
You can also view DDoS alert traffic details and recent or ongoing mitigations.
To view a DDoS alert summary:
- Depending on your DDoS product, you can access the DDoS Mitigation and Reporting dashboard using one of the following methods:
- Using the left menu, click Services, click Service Portals, then click DDoS Mitigation and Reporting. Confirm that you are going to an external site, then click Log In with SSO.
- Using the left menu, click Monitoring & Reports, click Security Solutions Analytics, then click DDoS Mitigation and Reporting (in either the Reports or DDoS Mitigation Service sections).
- Using the left menu, click Services, click Service Portals, then click DDoS Mitigation and Reporting. Confirm that you are going to an external site, then click Log In with SSO.
The DDoS Mitigation and Reporting portal shows the dashboard.
- Click the Alerts tab, then click All Alerts.
The DDoS Mitigation and Reporting portal shows all DDoS Alerts.
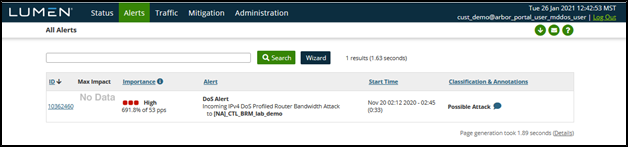
- Click an alert ID.
The DDoS Mitigation and Reporting portal shows the alert summary.


