Viewing backbone performance metrics
Using Network Visibility in Lumen Connect®, you can view backbone performance metrics for your network such as latency, packet delivery, or average jitter. By default, Lumen Connect shows current latency metrics between each of your locations. You can customize the table to view other metrics as well as historic data. Network Visibility also offers summary network performance reports.
To view backbone performance metrics:
- Using the left menu, click Monitoring, then click Network Visibility.
Lumen Connect opens Network Visibility. Tiles show a quick view of your network services: status, utilization, and performance. You'll also see tiles for threshold alerts, repair tickets, and scheduled maintenance (planned network maintenance). Below the tiles, you can view a list of your services by status, utilization, or performance, and those with threshold alerts, repair tickets, or scheduled maintenance associated with them. You can also view your services by location on a map using the Monitored Locations toggle. Use the Backbone Performance and Summary Reports tabs to access additional network performance data. (To refresh the data show, click thecached icon.)
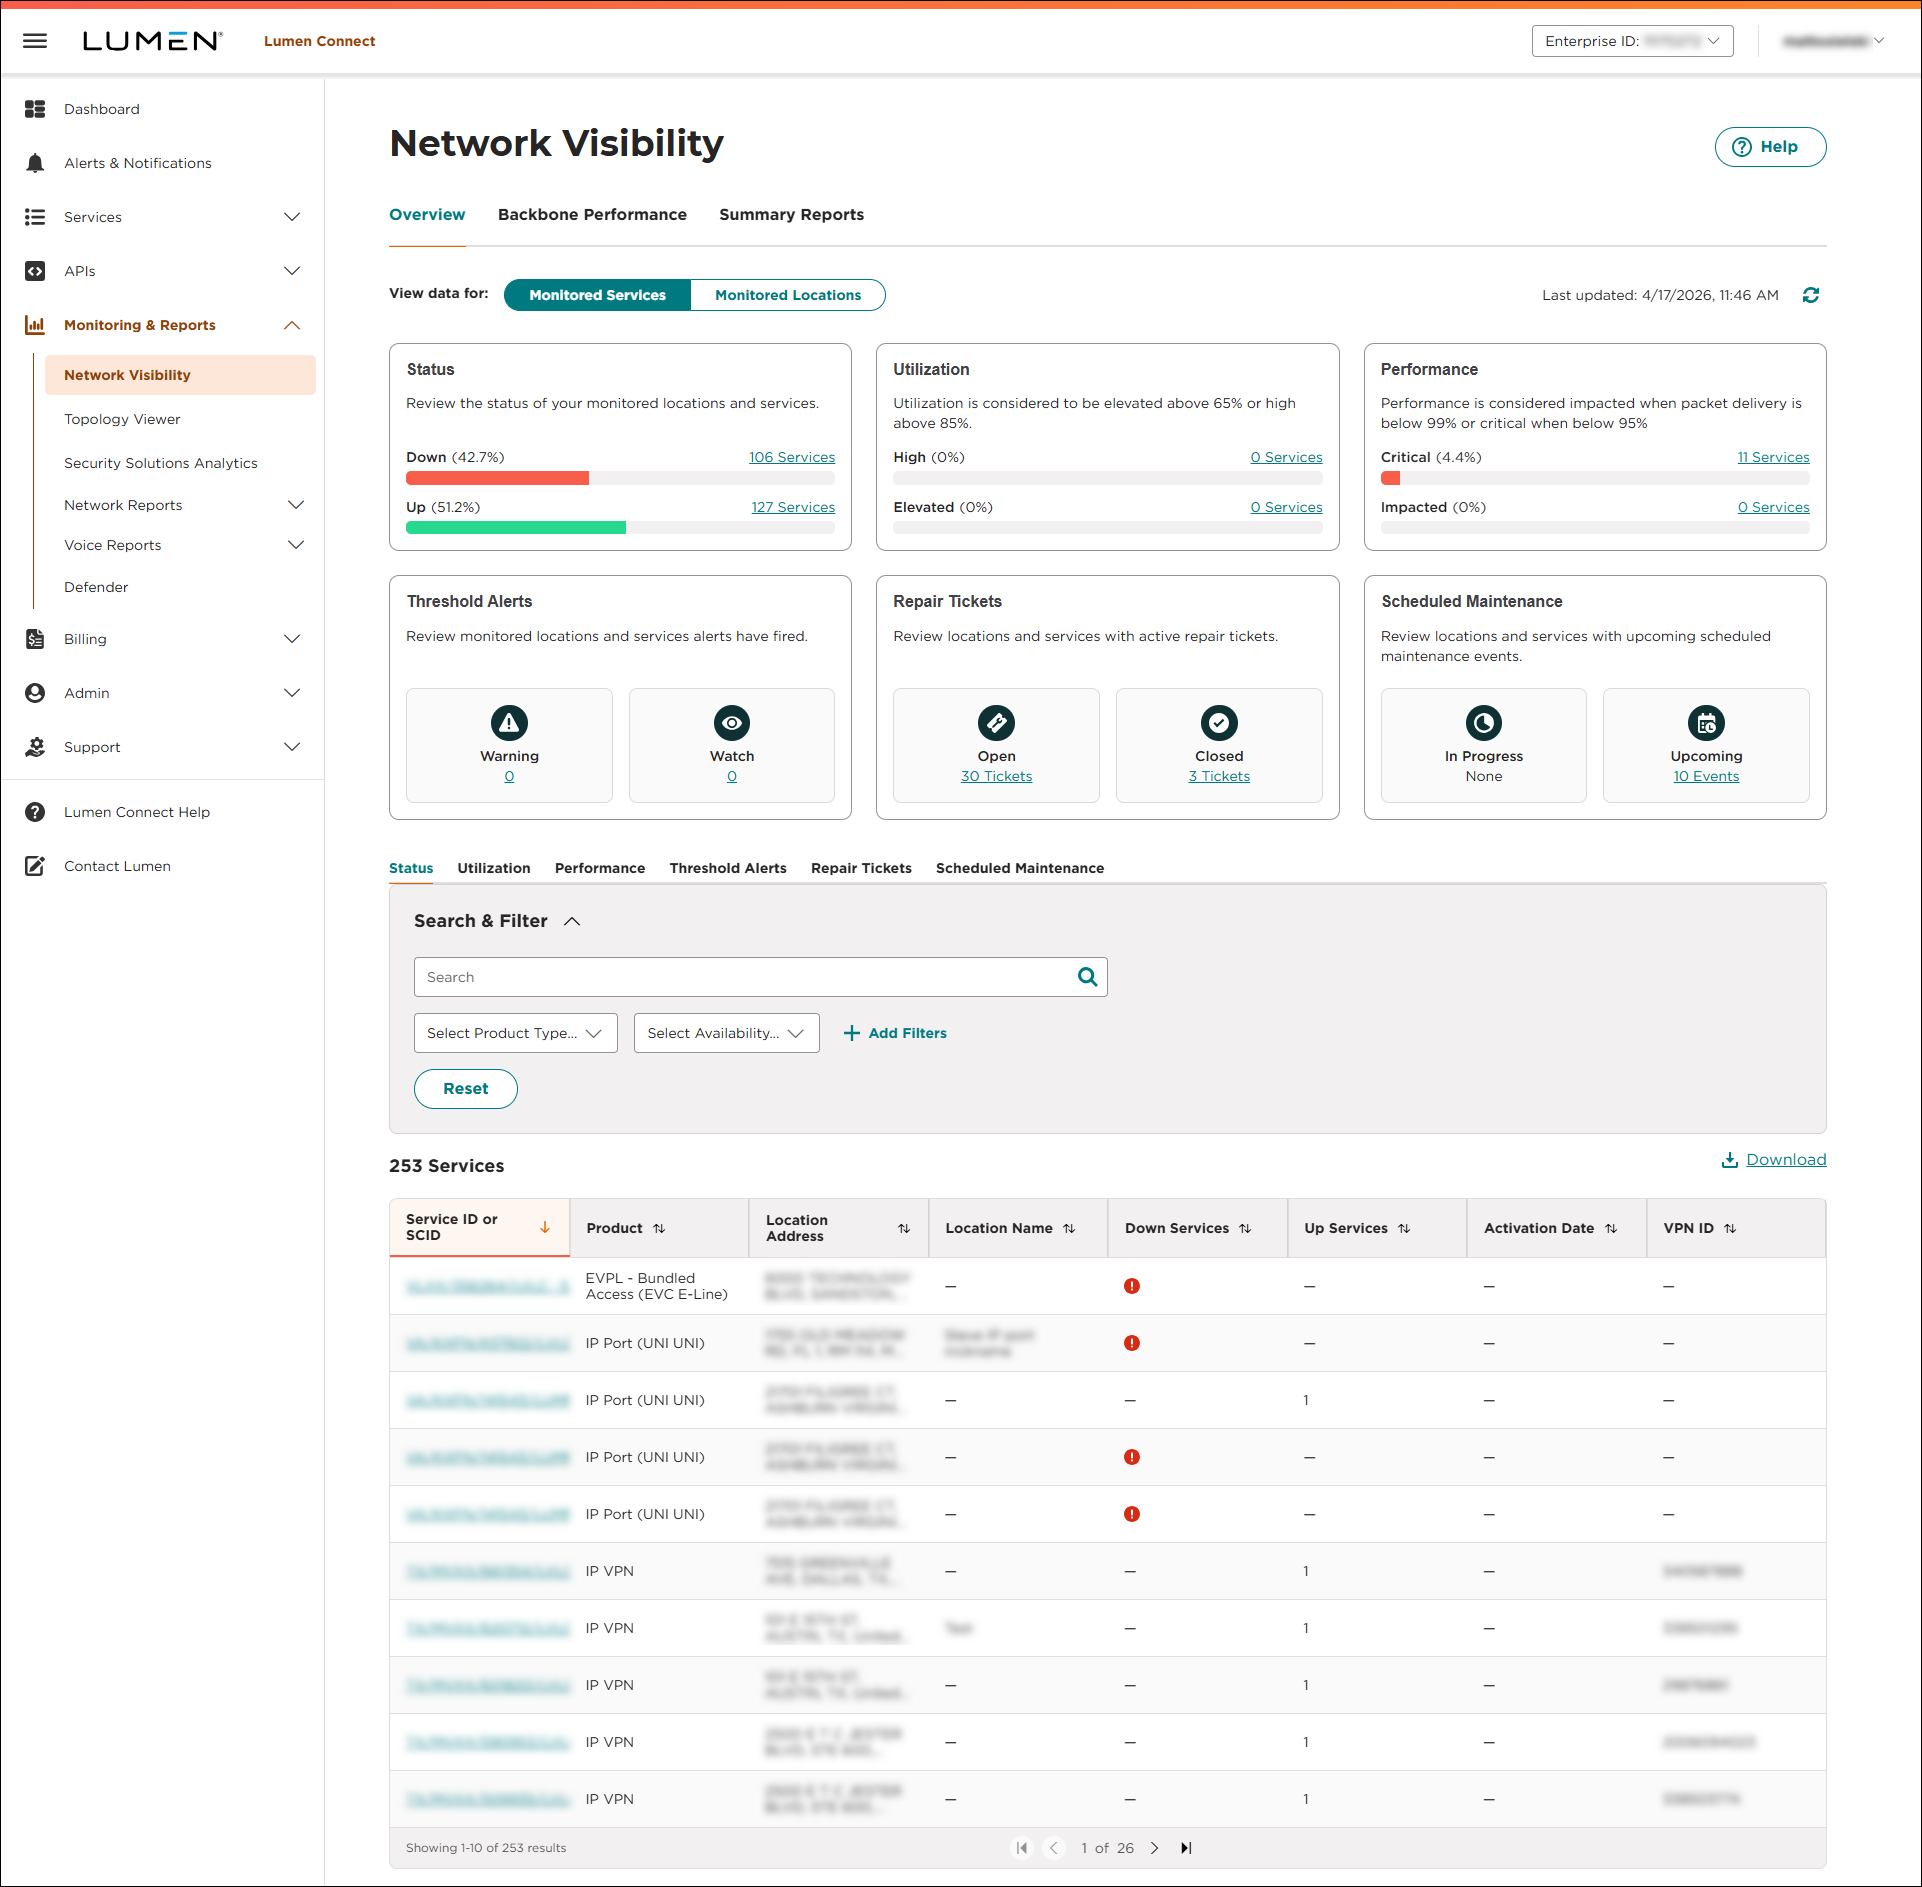
- Click the Backbone Performance tab.
- From the list, select the backbone you want to view performance metrics for.
Lumen Connect shows backbone performance metrics for your network locations. (To refresh the data shown in the table, click thecached icon above the backbone list.)
- To customize the backbone performance table, click the Filters section, then do any of the following:
- To adjust the region(s) shown in the table, select or clear the checkboxes for the regions. (For example, to remove locations in Europe from the table, clear the Europe checkbox.)
- To change the backbone performance metrics shown in the table, select an option from the list. By default, Lumen Connect shows latency metrics, but you can also view packet delivery % or average jitter metrics as well.
- To adjust the time period for the table, select an option from the list. By default, Lumen Connect shows current metrics, but you can also view metrics for the past hour, past day, or past 30 days.
- To filter the table to focus on metrics between two locations, click Filter, search for or select the radio button for the cities, then click Save. (To remove the filter, click Clear.)
- To adjust the region(s) shown in the table, select or clear the checkboxes for the regions. (For example, to remove locations in Europe from the table, clear the Europe checkbox.)



