Viewing utilization metrics for a service in Network Visibility
Using Network Visibility (within Lumen Connect®), you can view utilization metrics for Lumen network services. You can also use Network Visibility to view performance metrics for services.
To view utilization metrics for a service in Network Visibility:
- Using the left menu, click Monitoring, then click Network Visibility.
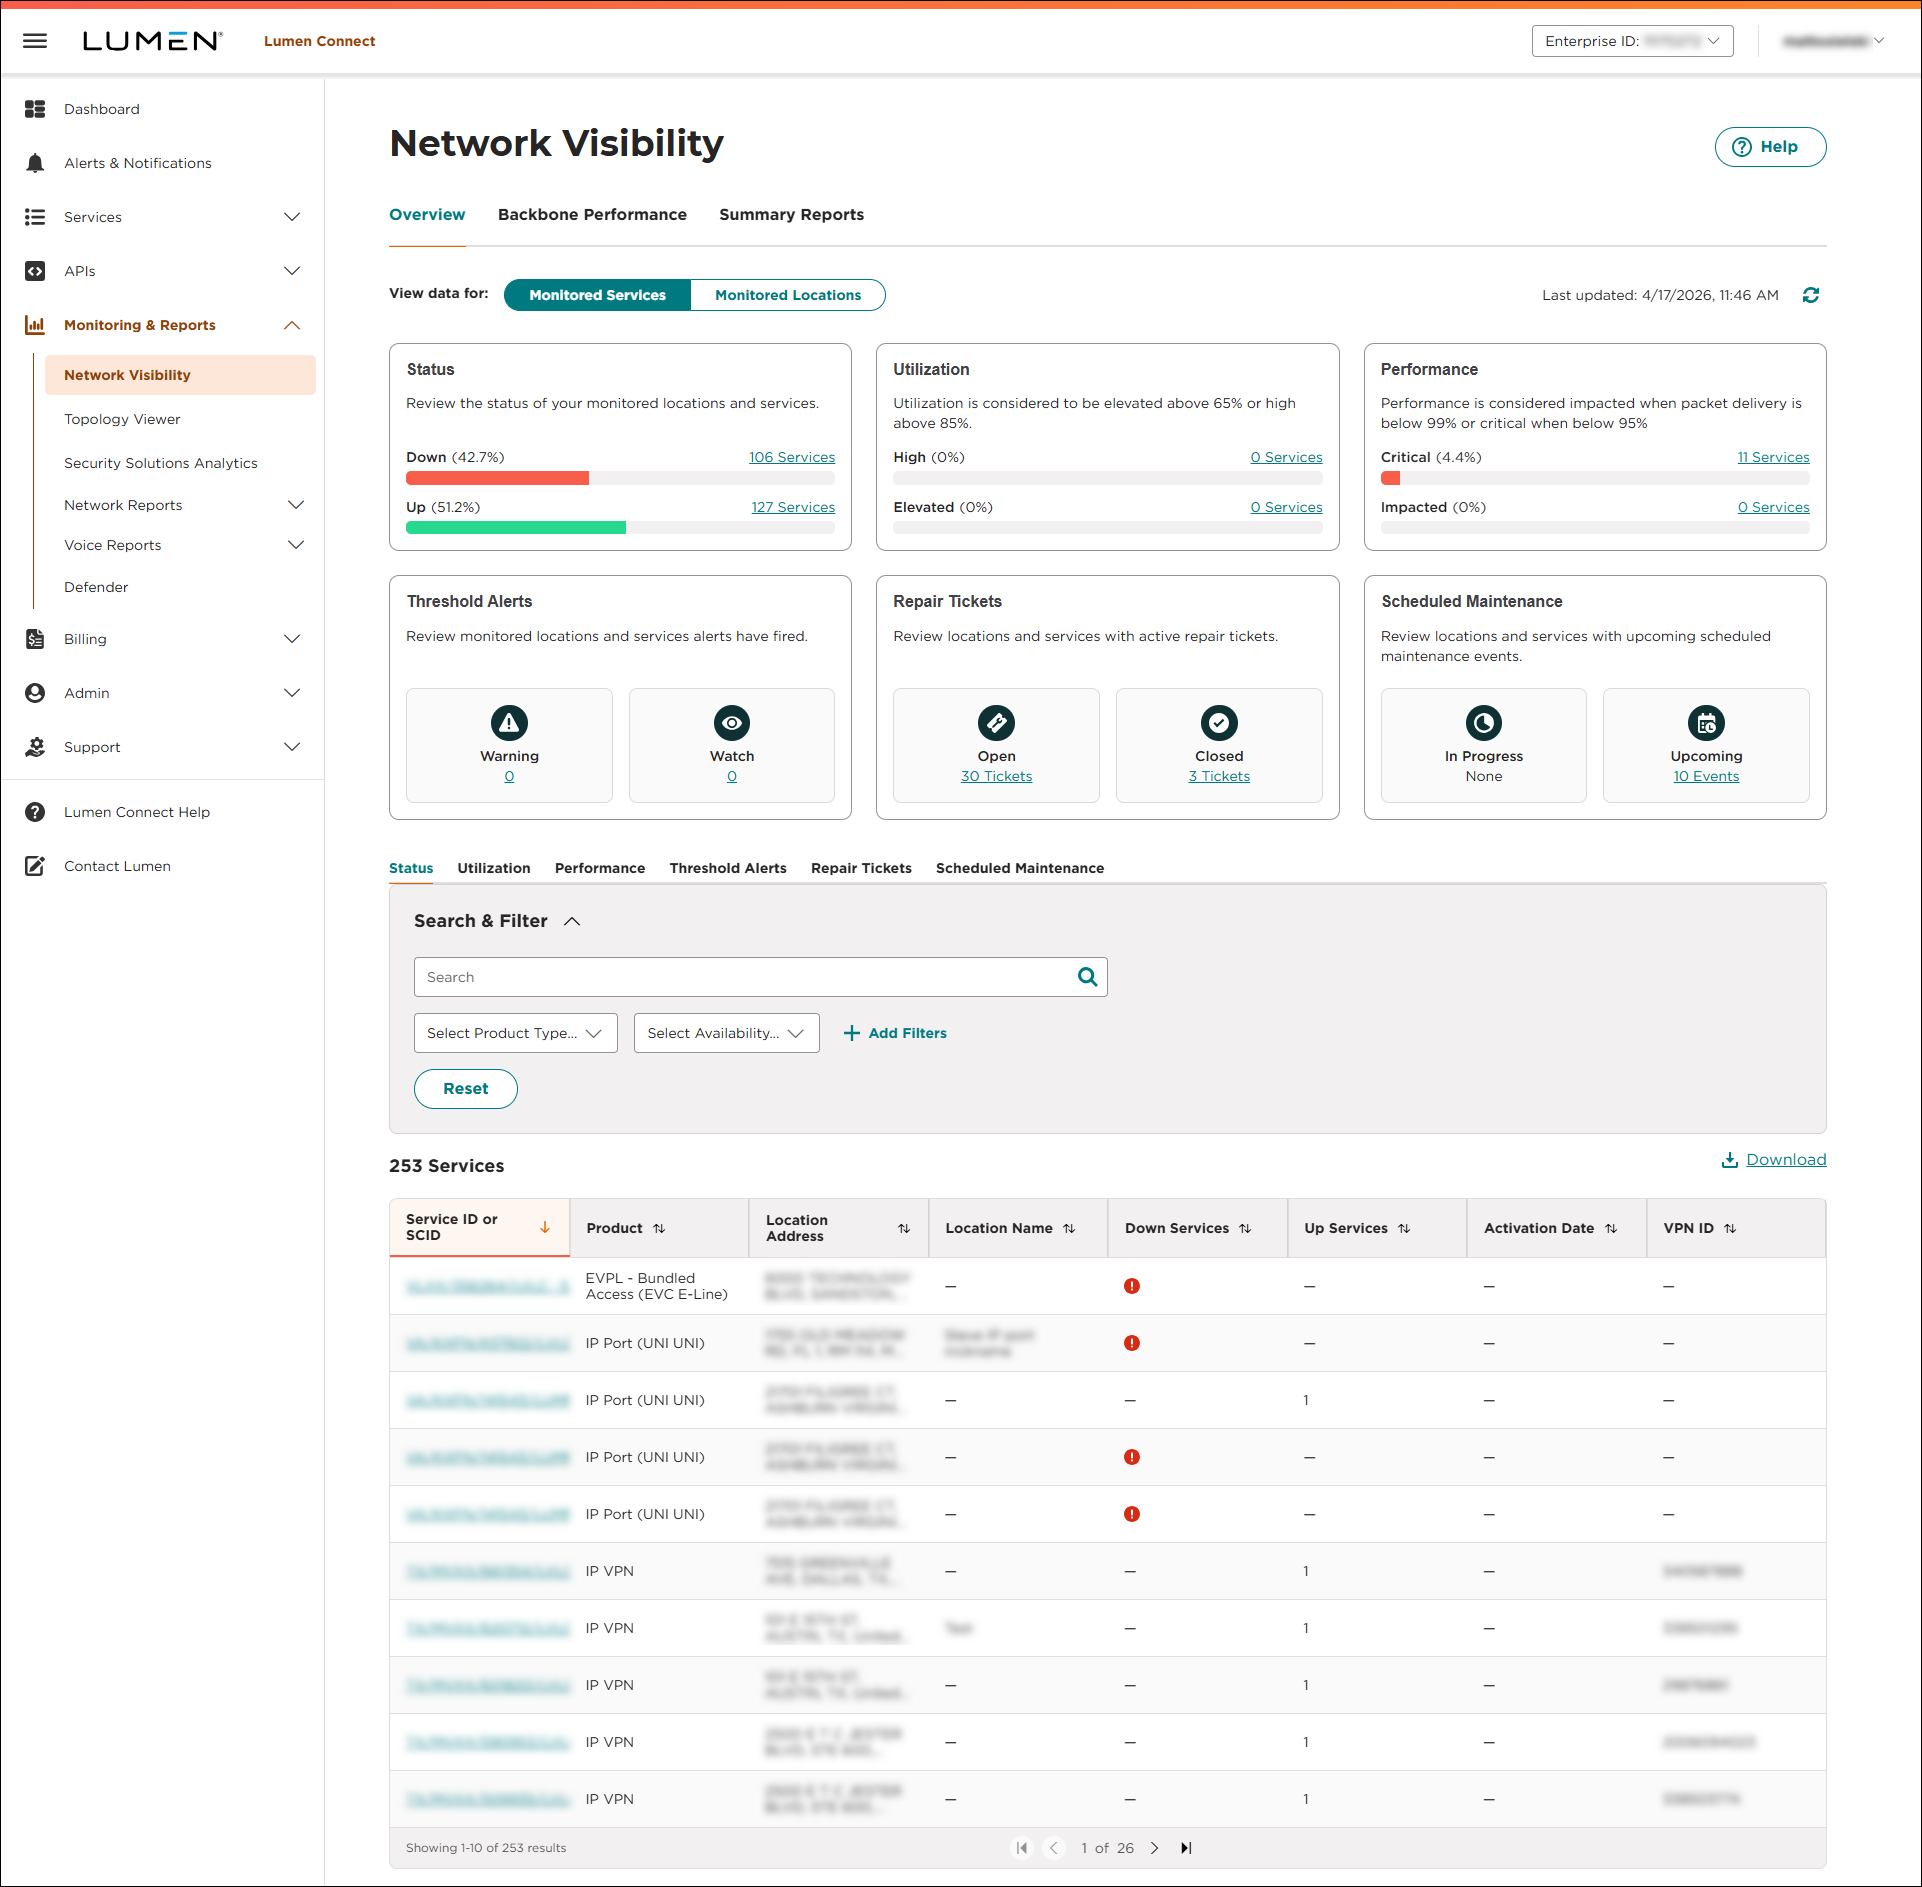
Lumen Connect opens Network Visibility. Tiles show a quick view of your network services: status, utilization, and performance. You'll also see tiles for threshold alerts, repair tickets, and scheduled maintenance (planned network maintenance). Below the tiles, you can view a list of your services by status, utilization, or performance, and those with threshold alerts, repair tickets, or scheduled maintenance associated with them. You can also view your services by location on a map using the Monitored Locations toggle. Use the Backbone Performance and Summary Reports tabs to access additional network performance data. (To refresh the data show, click thecached icon.)
- Search for the service you want to view utilization metrics for:
- To view metrics for a service with high utilization (over 85%) or elevated utilization (over 65%) from the Monitored Services view, click the link next to the High or Elevated KPIs (on the Utilization tile), then scroll down and click the link in the Service ID or SCID column.
- To view metrics for a service from the list of services, scroll down below the tiles, click the Utilization tab, then select the service from the list. (Use the search and filter options as needed to locate the service.)
- To view metrics for a service from the Monitored Locations view, click the Monitored Locations toggle, click a location on the map, then click the Show details link for the location.
- To view metrics for a service with high utilization (over 85%) or elevated utilization (over 65%) from the Monitored Services view, click the link next to the High or Elevated KPIs (on the Utilization tile), then scroll down and click the link in the Service ID or SCID column.
Based on the service you selected, Lumen Connect shows all services that location.
- Click the row for the service you want to utilization metrics for.
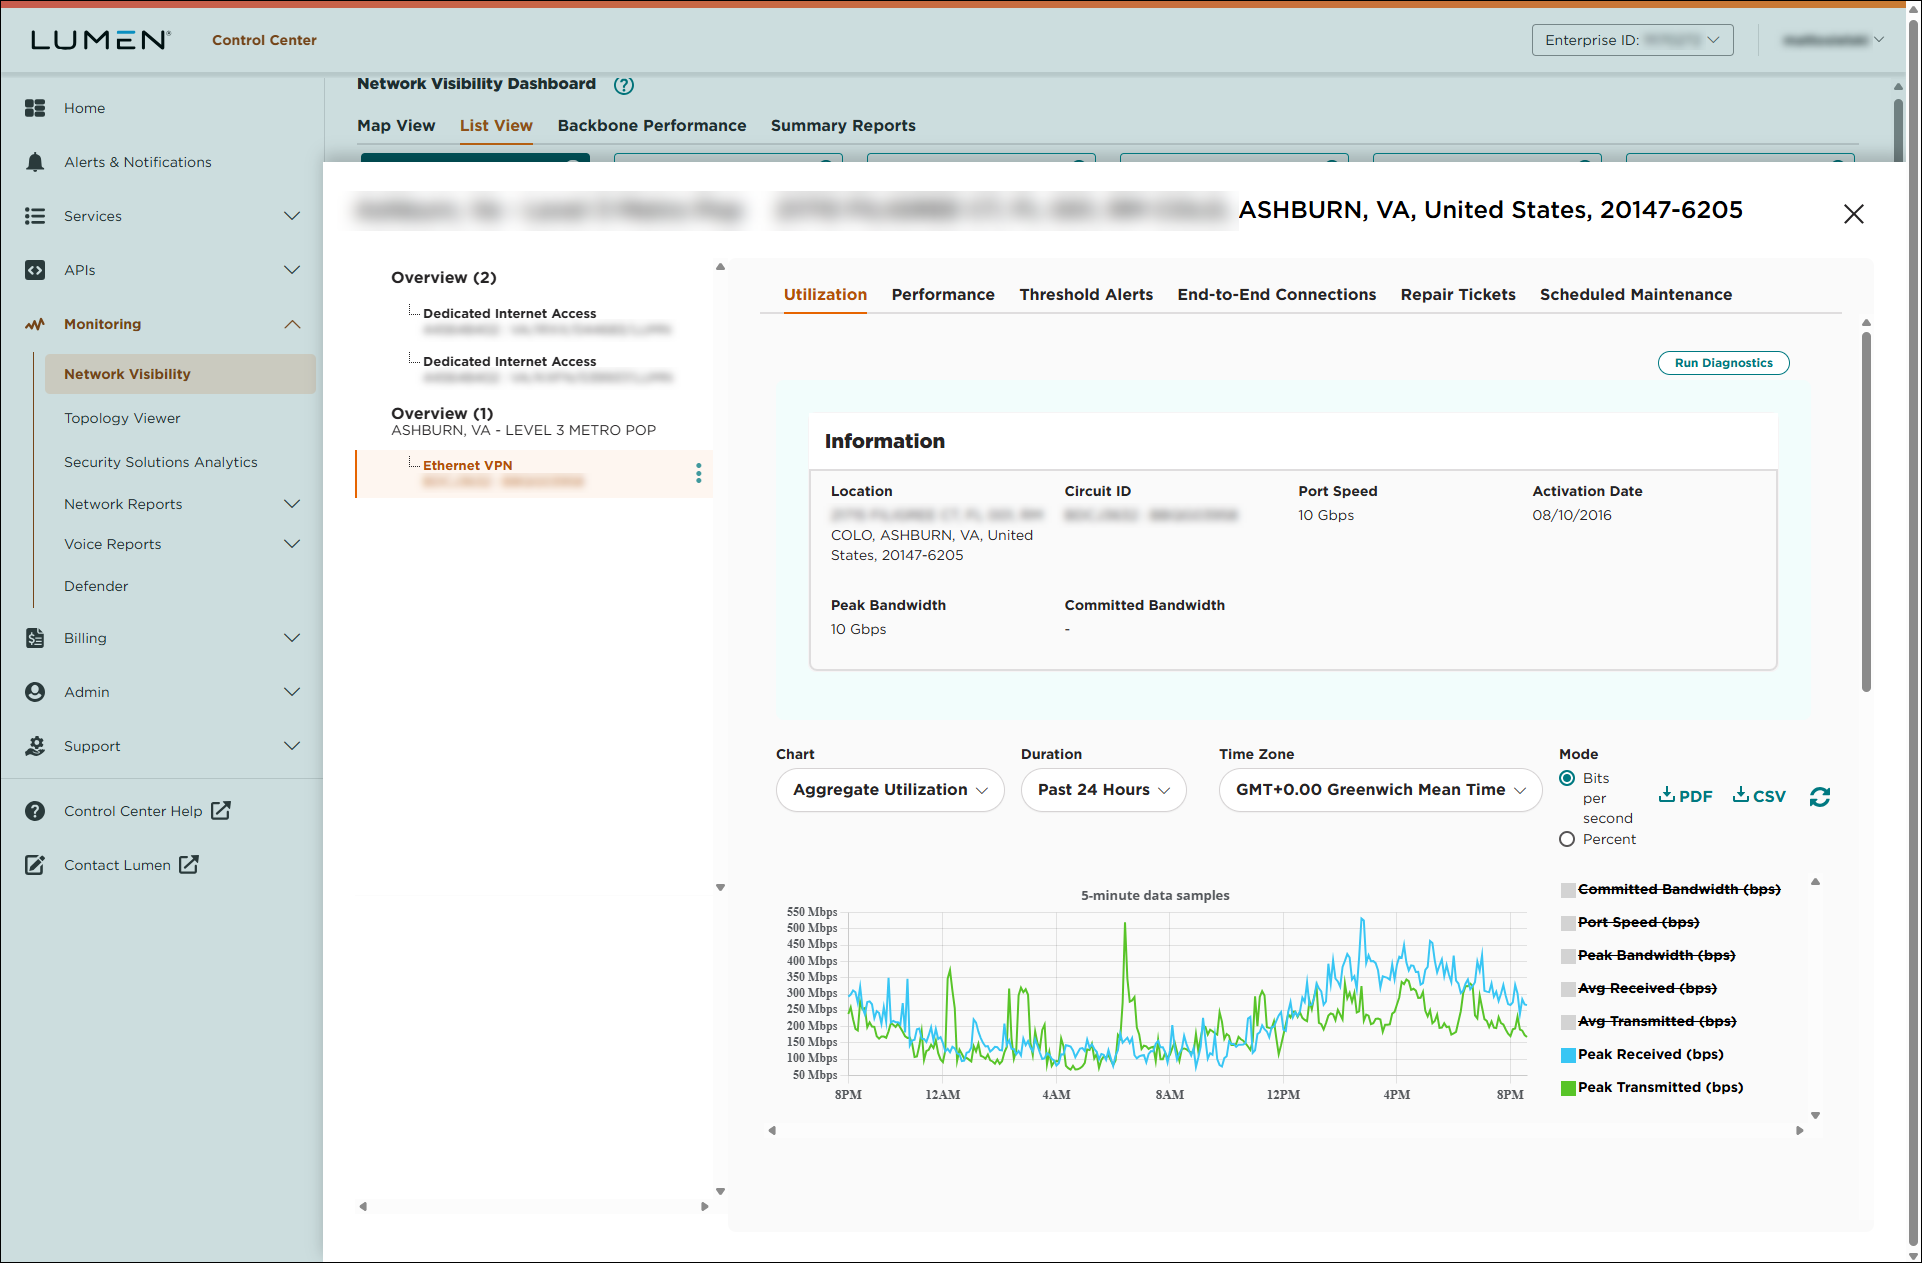
Lumen Connect expands the row to show details for the service—including utilization metrics for the past 24 hours. Transmitted data is from you to the Lumen core; received data is from the Lumen core to you.
- Do any of the following to customize the utilization metrics shown:
- To change the metrics shown on the chart, select an option from the Chart list. (Utilization metrics vary based on the service you selected.)
- To change the time period for the utilization metrics shown, select an option from the Duration field. You can see metrics for the past eight hours, past 24 hours, previous day, past seven days, past 30 days, previous month, past 365 days, or using a custom date range. (By default, Lumen Connect shows utilization for the past 24 hours.)
- To change the time zone for the data shown on the chart, select an option from the Time Zone list.
- To change the measurement used for utilization, select an option from the Mode field. You can show data in bits per second or as a percentage of the peak bandwidth for the service.
- To change the data shown on the chart, click the data options on the right side of the chart to toggle them on and off for the chart. Data elements shown on the graph show a key color; data elements hidden from the chart appear with a strikethrough.
- To change the metrics shown on the chart, select an option from the Chart list. (Utilization metrics vary based on the service you selected.)



